
Review Card — R4
Sep 04, 2026 – Oct 06, 2026
R4 Cycle Analysis: Sustained Field & Near-Baseline Lag Response
Reported global record coverage (UTC): – . The review contains 778 global records and 778 topology records.
Field & Structure Snapshot
- Global MFI mean: 87.21 · Standard deviation: 2.69.
- Maximum MFI level: 94.15.
- MFI > 90: 116 observations · 14.91% of global records.
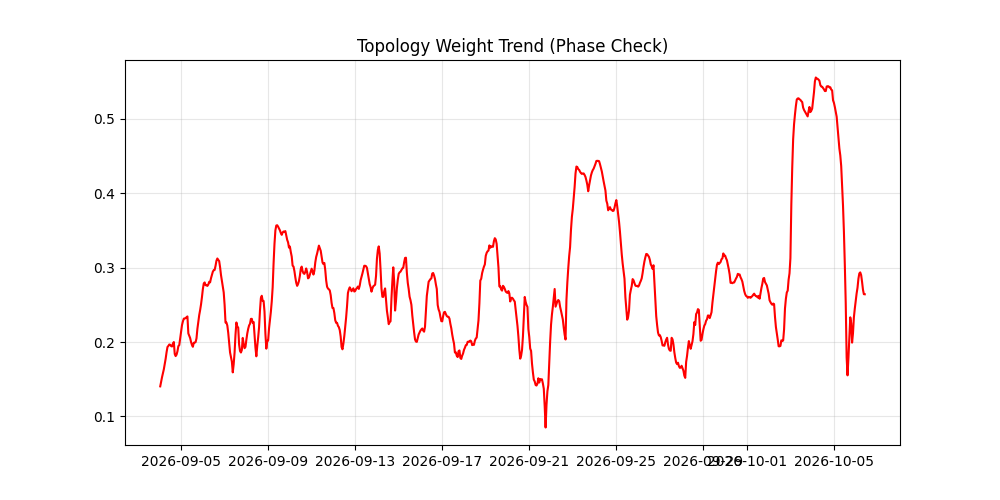
- Mean topology edge weight: 0.280 · Mean node count: 5.0.
- Lag Compression Index (LCI): 0.9372 · Neutral classification.
- 24–48h lag-window weight relative to the cycle mean: −6.28%.
- Last-seven-day topology slope: +0.000911 per record · Inside the analyzer's horizontal tolerance.
- End-of-window inverse edges: 7 · Trend classified as flat.
Flow Impulse Profile
The topology series provides 777 measurable ΔMFI transitions. The first record supplies the baseline and is excluded from transition counts. 773 of 777 transitions (99.49%) fall inside the Stable Flow interval.
| Classification | ΔMFI interval | Count |
|---|---|---|
| Positive Flow Shock | ΔMFI > +12 | 0 |
| Rising Instability | +6 < ΔMFI ≤ +12 | 3 |
| Stable Flow | −6 ≤ ΔMFI ≤ +6 | 773 |
| Falling Instability | −12 ≤ ΔMFI < −6 | 1 |
| Negative Flow Shock | ΔMFI < −12 | 0 |
Intermediate upward excursions occurred on Sep 11 at 15:05:08 UTC (+6.22), Sep 16 at 19:05:07 UTC (+7.36), and Oct 04 at 23:05:16 UTC (+6.24). The latter was followed by a −6.41 excursion on Oct 05 at 00:05:09 UTC.
This final rise–fall sequence moved MFI from 84.28 → 90.52 → 84.11, leaving a net change of −0.17 at the reported precision. Both changes belong to the intermediate instability classes; no transition crossed either extreme Flow Shock threshold.
Lagged Structural Response
All 116 high-MFI observations contributed a nonempty 24–48h topology window. Their mean window weight was 0.2621, compared with the full-cycle topology mean of 0.2796. The reported difference is −6.28%, yielding an LCI of 0.9372.
The lag-window mean remains below the cycle baseline, but it falls within the analyzer's neutral LCI band of 0.90–1.10. Neutral is therefore a tolerance-based classification; it does not imply an exactly zero response. The reviewed lag statistic supplies no positive delayed-compression result for R4.
Structural Interpretation
- Higher mean field with narrower dispersion: Mean MFI increased from 86.56 in R3 to 87.21 in R4, while standard deviation declined from 3.28 to 2.69. Stable Flow remained the dominant transition class. Although high-MFI observations increased from 101 to 116, their share of global records declined from 15.71% to 14.91% in the longer window.
- Weaker negative field–structure association: The time-aligned correlation moved from −0.4353 in R3 to −0.2844 in R4. Mean edge weight was 0.2480 when MFI > 90 and 0.2921 when MFI < 80, a reported gap of 0.0441. The contrast is smaller than R3's 0.1672 gap; statistical independence, causal coupling, and significance are not established by these summaries.
- Lag statistic closer to its cycle baseline: LCI increased from 0.7971 to 0.9372, while the lag-window difference narrowed from −20.29% to −6.28%. R4 consequently enters the neutral class under the same stated thresholds. These are comparisons against each cycle's own baseline.
- Local strengthening with reversals: Minimum mean edge weight occurred on Sep 21 at 18:05:15.750 UTC; the maximum occurred on Oct 04 at 04:05:05.494 UTC. The chart shows a pronounced late-cycle strengthening episode followed by a sharp decline. The full-cycle summary's clustering label uses the sign of its fitted slope. The last-seven-day slope of +0.000911 per record remains below the analyzer's +0.001 rising-trend threshold. These measures do not establish persistent compression.
- Inverse structure: R4 ended with 7 inverse edges, compared with 3 at R3's endpoint. The R4 within-window trend was nevertheless classified as flat. Different endpoint counts do not establish a sustained increase or a change in market fragility.
R4 Dynamic Signature
Elevated MFI · Predominantly stable ΔMFI · Intermediate rise–fall sequence · Lag-window connectivity closer to the cycle baseline
Final Assessment
R4 is descriptively classified as an Elevated Field / Neutral Lagged Structural Response cycle. Field levels remained high, extreme Flow Shocks were absent, and the negative lag-window difference was smaller than in R3. Episodic topology strengthening is visible, while the reviewed statistics provide no basis for claiming a validated phase transition or a persistent compression regime.
Method & Evidence Scope
Numerical statistics are taken from the recorded R4 terminal outputs. Calculation rules were inspected in the supplied Python analyzers. The underlying JSON exports were not supplied for an independent recomputation.
LCI divides the mean of per-anchor 24–48h window means by the full-cycle mean edge weight. Every MFI > 90 observation is a potential anchor, including consecutive observations. A window is retained if it contains any topology record; complete coverage is not required. Windows can overlap, so the 116 usable anchors are not 116 independent shock episodes. The analyzer classifies positive LCI values below 0.90 as absorbing, 0.90–1.10 as neutral, and above 1.10 as compression.
ΔMFI compares successive timestamp-sorted topology records without normalizing for time gaps. Correlation and conditional means match each global record to the latest topology record at or before its timestamp, with no maximum matching gap configured. The recent slope is fitted over the last seven days against record position. These are descriptive rules; they do not establish causal responses or physical phase boundaries.
Market Flow Physics · Review Archive · Cycle ID: R4-2026-10